


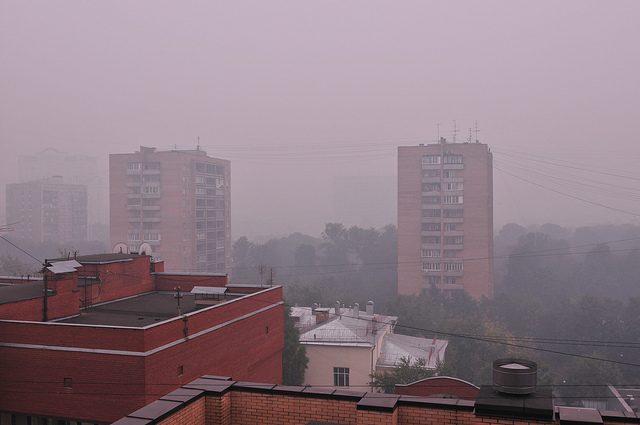

If you live in a French city with at least 100,000 people, you likely encounter the Atmo air quality index during your daily commute. It is not a complex scientific metric designed to confuse, but a straightforward scale ranging from 1 to 10. A 1 means the air is very healthy. A 10 indicates heavy atmospheric pollution. Most of the time, you will see numbers sitting somewhere in the middle, but understanding what drives that number can change how you plan your day.
The Four Key Pollutants Behind the Score
The index does not measure “dirt.” It looks at specific chemical concentrations expressed in micrograms per cubic meter (µg/m3). The calculation relies on four primary pollutants.
Ozone (O3) is one of them. It is a gas that forms when sunlight reacts with other pollutants. Then there is sulfur dioxide (SO2), often linked to industrial processes and burning fossil fuels. Nitrogen dioxide (NO2) comes largely from vehicle exhaust and heating systems. Finally, the index tracks fine particulate matter, known as PM10. These are tiny particles that can penetrate deep into the lungs.
Each of these four components gets its own sub-index. The final Atmo score is simply the highest value among these four. If ozone is clean but particulate matter is high, the index reflects the pollution level of the particles. It is a worst-case scenario approach. It assumes you should prepare for the worst condition present in the air.
How the Calculation Works in Practice
Stations located inside or on the edge of cities collect the data. These stations do not just take a single snapshot. They monitor maximum hourly concentrations for ozone, sulfur dioxide, and nitrogen dioxide over a full 24-hour period. For the fine particulate matter, they measure maximum daily concentrations.
Once the 24 hours are up, the system averages these concentrations. This average determines the sub-index for each pollutant. Because the final index is the maximum of the four sub-indices, a single spike in one pollutant can raise the whole score. This is why the index can jump unexpectedly.
Predictions are also part of the system. Meteorological and traffic models allow experts to forecast the air quality for the next day. This helps people plan ahead, though forecasts are never perfect.
Where the Data Comes From
You might wonder why the index does not exist for every city. The requirement is strict. A region needs measurement stations capable of tracking all four pollutants to generate a valid Atmo index. Not every urban area has this infrastructure. Consequently, large towns without the necessary monitoring equipment fall outside the scope of the index. The data relies on physical stations. If a station cannot measure all four components, the calculation cannot proceed.
Who Needs to Watch the Numbers
The index is not just for curiosity. It serves as a warning system. Medical guidelines specifically advise vulnerable groups to monitor these scores closely. This includes people with asthma, young children, and the elderly. When the index spikes toward the higher end of the scale, these groups should avoid going outside.
“It is particularly advisable to monitor the Atmo index for fragile individuals who must avoid going out during pollution peaks.”
The logic is simple. When particulate matter or ozone levels rise, breathing